


Explore industry-best offerings
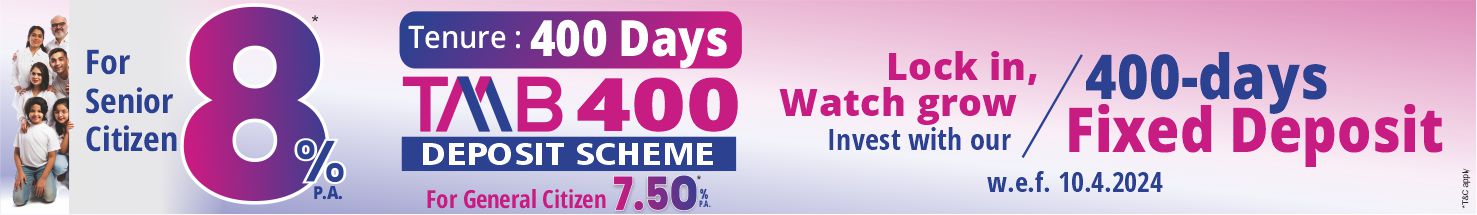
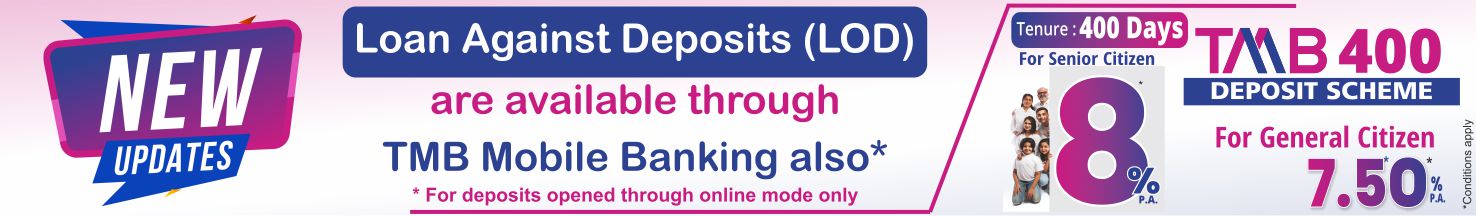
TMB offers higher rate of interest for your deposits

TMB has enhanced the service offerings for the Royal and Elite generation
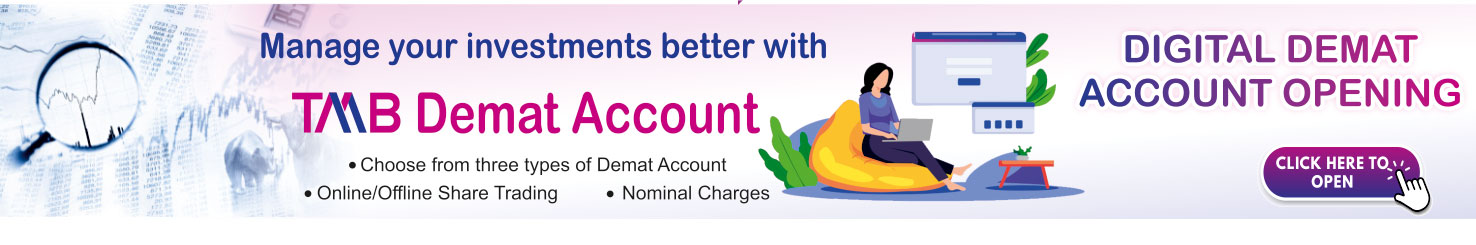
TMB provides various internet banking facilities that help and ease the banking experience
Experience the ease of banking wherever you are
Out of my experience of transacting with several banks, I wish to state that the service and technology offered by TMB Ltd. stands the best of all.
On behalf of my sister, it is my immense pleasure to thank you all from the bottom of my heart, for the financial assistance. This loan is like a boon for us, hailing from a less privileged background. You can have no idea how much your help has meant. Here I like to mention that, the time frame for processing and approval is very less and fast compared to all other banks. Especially, the kind behavior of manager towards the customer feels like better than anything. It definitely made things easier, emotionally as well. Again, I wanted to let you know that I appreciate the help and support. Thank you for the high level of customer service and keep investing in quality students.
We are banking with TMB since the last 20 years and have been a profit making and growing concern ever since. Many thanks to the continued support and co-operation extended by the bank.
The Bank is expanding its presence, to serve you better! We are excited to announce, our 553rd , 554th ,555th & 556th Branch at Thirubuvanam (Thanjavur Dist.), Holenarasipura (Hassan Dist.), Denkanikottai (Krishnagiri Dist.) and Kadayampatti (Salem Dist.) are to be opened on 22/04/2024.

Unclaimed Deposit Gateway to Access inforMation (UDGAM Portal)
Click here
Secured assets possessed under the SARFAESI Act
Read More
Basel III Disclosures
Read More
Notice of the 101st Annual General Meeting
Read More
Annual Report 2022-23
Read More
National Portal for Credit-Linked Government Schemes - JanSamarth
Revision in service charges w.e.f 01.10.2022
Read More